Will Groves
Methods 4
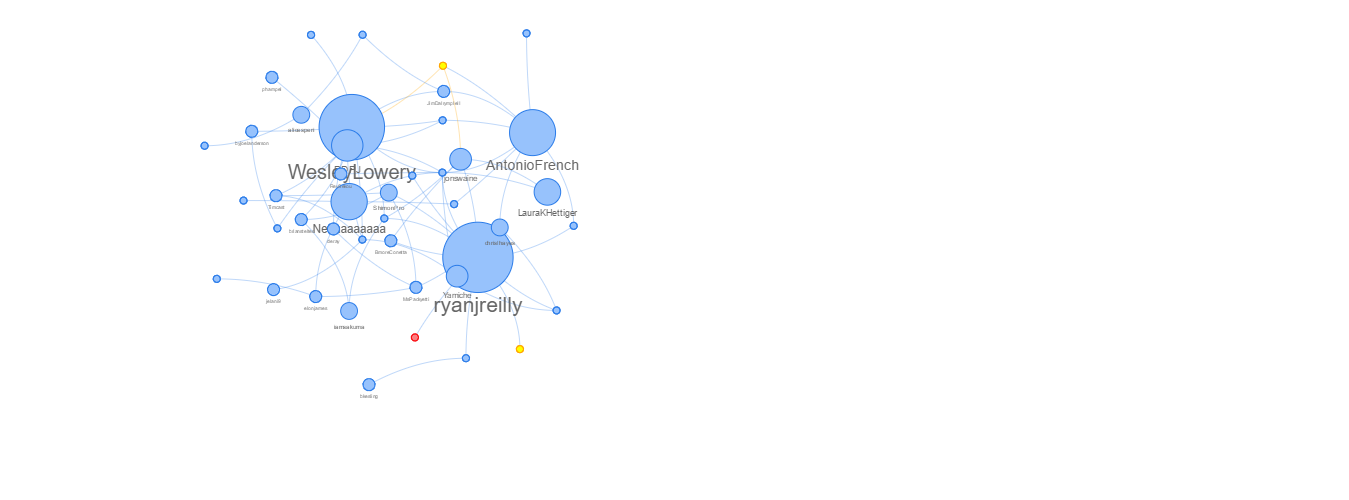
For my network map I wanted to explore more deeply the ways in which the shooting of Michael Brown was portrayed through the media. Linking nicely with my research project, I decided to take a look at the first two weeks (August 7th-August 22nd), and I wanted to know was who the major players were, and how they displayed the events that unfolded. I want to specifically know how emotion played a role in the dissemination of information, essentially if were they affective or objective. Using only the key words of media, reporter, journalist, journalism, or reporting, I wanted to gather as many Tweets as possible from this data set, in order to yield a wider range of results. By utilizing the network map function in Pulsar, I will be able to visually see who the influencers were, along with the magnitude to which they reached. Though this project will show no emotion or Tweets themselves, I think by using the same data set throughout, it will allow me to know who to follow more closely in my further research.
As you can see by the network map on the side column, there were a few major players in the world of Twitter during this time. Of the major players, both journalists and activists were heavily involved. One journalist from the Huffington Post, Ryan J. Reilly (@ryanjreilly), seems to have the biggest circle in the data set. Of the nodes that extend from Reilly’s circle, several of them go to other journalists, but interestingly enough, several of them go towards activists. These are the Tweets that I will be looking at intently. The interaction between journalists and activists could potentially lead me to some interesting information, which was either broadcaster for the world to see, or swept under the carpet due to the plight of the media. Another interesting finding I have drawn from the network map is that a majority of the influences, both journalist and activist, had more than one node extending from it. In many of the other more specific data sets the ‘one way’ users are more prevalent. This is important to note because it will help me further know the inner workings of who was talking with how, and how that information could get passed along in a wider manner. I think a visual representation of the scope of this social movement will help paint a fuller picture of the events that transpired in those first two weeks.
- Log in to post comments