Professor Barnard
Twitter & Society
4-15-16
Method 4: Network Mapping
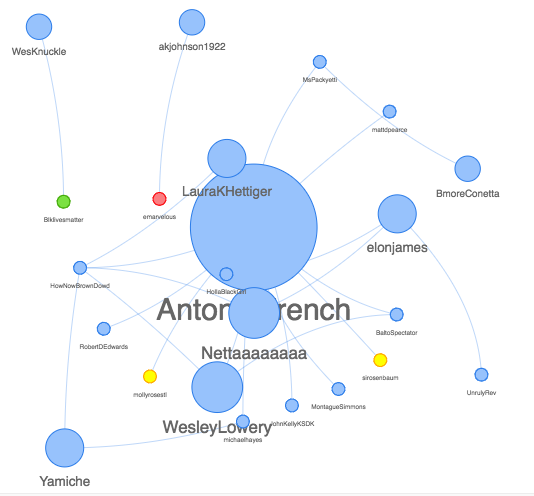
In my network, I set the time frame from August 9th, 2014 to August 21st, 2014. I chose this time because I was interested in seeing the initial reactions and perspectives of both the journalists and activists starting from the day Michael Brown was shot till the day that the Grand Jury began. The types of media that I included in the creation of my network were “Text Only” and “Photo”. The keyword that I included in my search was “Justice.” I chose this word because I wanted to see how journalists used the word versus how activists did. After setting these parameters, I took a look at my map and began to analyze the connections between users.
There were 23 total people in the network, 10 of which were journalists, 13 activists. Most of the journalists work(ed) for tv news outlets, but there were occasional journalists that worked for websites such as Buzzfeed. Many of the activists were calling for justice in the situation. Antonio French had the largest influence with 9 responses, 6 of which were from like minded journalists. Homophily really made its impact here, as the tendency to follow and respond to like minded individuals was the case with French.
Looking throughout the map, although there were no singular nodes, there were some points that only had a singular connection between them. These points were separated from the main web. Other than these points, the main connections between users were based on a journalist tweeting out with an activist responding. When I clicked on most of the journalists to see their connectors, most of the connecting points went to users that were activists. There were not too many journalists responding to activists. I believe that this pattern in my network was due to the relationship that journalists and activists have. Journalists are stereotypically the ones who first publish news and then activists respond to this news, preaching their opinion or discourse about said news. I interpret this pattern as activists using what the journalists publish and say as ammunition for their tweets and protests. Activists will still express their opinion regardless of what journalists post, but more often than not, I see activists expressing their disapproval of what the media says/does about how certain issues are covered.
One of the benefits that the network feature shows is the “Bird’s Eye View” from the article “Mapping Twitter Topic Networks: From Polarized Crowds to Community Clusters” by Marc Smith and a cast of other authors. The ability to see interactions on Twitter from an aerial perspective really provides clarity to how users such as journalists and activists relate and converse with each other. We are able to see how “Each group can be more or less connected to other groups. These structures tell a story about the kinds of interactions that take place in Twitter” (Smith).
In terms of what gets left out of the network map, sentiment is something that gets lost in the map. Activists could have positive sentiment about a negative issue, possibly being sarcastic about a serious topic. This and other small scale qualitative measures are tough to measure with the network map. The network does do a great job of showing homophily, the power law, and edges.
- Log in to post comments