Introduction
Twitter is a popular and highly visible form of mass communication in the world today, which through socialization has transformed the media networking experience of virtual communication accessibility as we know it. When an incident occurs, like the one on August 9th 2014 at 12:01am when Michael Brown was shot, a figurative timer starts. In the 24 hours that followed, in the next week, few months, next year, discourse happens including a wide range of different forms of media including text, pictures, videos and hyperlinks on social media sites like Twitter. In the following research paper I will analyze archived tweets about Ferguson isolating specific time frames in order to gain a better understanding of the patterns of media usage in tweets. I narrowed my research into three time frames for multiple reasons based off of information noted below in literature cited. The relevance of the first 24 hours (August 9-10), the first week (August 10-16), and the second week (August 16-23) provided me with ample data to interpreted my preliminary question; which forms of media are used the most when and what might explain why they are used when they are? I used network analysis techniques and tagging methods on Pulsar to identify and categorize tweets that feature text only, pictures, videos or hyperlinks. This research is important because it helps forward our understanding of how and when media is shared on Twitter. Understanding how information is shared in the 21st century is paramount to being able to receive and interpret news usefully.
Literature Review- The Evolution of the Revolution; Twitter
The research I’m conducting is backed by notable studies and previous in depth analysis into topics of shared interest. The following relevant portions of literature support the points my own study concludes upon.
Twitter, the social media platform utilized most to conduct this research, has morphed since its origin in 2006 into one of the most formidable communication technologies. This microblogging phenomenon is revolutionizing web conduct and journalism (Java 2007). The evolution of Twitter as we know it today has been user driven, “think of it as innovation born out of necessity”(MacArthur 2014). Twitter’s origin story begins with co-creators Jack Dorsey, Noah Glass, Biz Stone and Evan Williams. While working for a podcast company the friends spent their spare time designing what they thought would be the next great SMS-based communication platform, like texting but not (MacArthur 2014). Twttr (the original name) was on the brink of hitting super stardom in 2007 at the South By Southwest(@sxsw) interactive conference. However, as the number of monthly Twitter contributors grew the company experienced some growing pains (MacArthur 2014). User innovation and commitment to Twitter helped shape and evolve Twitter into the communication powerhouse we see today. Changes and additions coming from the user base include the @ tagging function and the creation of retweeting. While changes in the name of innovation, ease and necessity have been made; the 140-character count (originally from the days when Twttr was an SMS centered communication system) has withheld the test of time, “think of it as a creative constraint”(MacArthur 2014). The 140-character count limit ties this backstory to my research. With the addition of more tweetable forms of media; pictures, videos and hyperlinks, this character limit has been tested and, in some ways, given the run around. The addition of a picture, which as we know is worth a thousand words, or citing a link to another page that might contain a full blow research report, has, in many ways, made this character limit irrelevant. Inclusion of media in tweets is revolutionizing the stream of instantaneous news received daily all over the world.
Event Specific Twitter Takeovers
Another aspect of related Twitter background connected to my area of interest revolves around specific events. Tweeting about a recent newsworthy topic has the potential to elevate ones online presence and raise their voice in their sphere of influence.
Research articles focus on a specific topic or time frame. My research which is focused on the specific event in Ferguson when Mike Brown was shot is just one of countless times the internet, Twitter in my case, has risen to the challenge and given the voiceless a means of expression. In another example researcher Giordano dove into a portion of the tweets sent within one hour of the Boston Marathon Bombings on April 15, 2013 to answer several research questions (Giordano, 2014). Giordano claimed that her findings demonstrated how social media can spread information and how it is important that media channels have well-established platforms if they hope to reap success in the form of visibility. The conclusions confirmed that the majority of the tweets in the first hour after the Boston Marathon Bombs had emotional sentiment and reactions closely followed by tweets giving information and tweets inquiring about the events. It was also brought to light that tweets containing information were shared more, and if these informational tweets came from reputable media sources they got even more retweets. In the 2011 Egyptian uprising, which lead to the resignation of President Mubarak, Twitter's evolving communication network elevated ordinary tweeters to prominence allowing more and more networks and spheres of influence to join in the cause (Meraz 2013). After monumental events like these, and in Ferguson, people turn to Twitter to give and receive live up-to-date information and also express their reactions. People want a venue to express themselves and make their voices heard, while at the same time having a clear and concise stream of news and information flowing to them.
Time and Media
Connecting the rational for the introduction of media into Twitter, to the specific ways Twitter can be used in light of events, leads me to the final aspect of my personal research, time. The relation between tweetable media and when said tweets are sent after news worthy event can provide valuable insights. Insights that can help Twitter consumers better understand and better predict the information coming across their feeds, and also help guide activists and journalists when deciding what types of media to tweet when.
Time is money in the broadcasting and media world. Hearing about, and being the first to report on an issue, are staple goals for communication technology organizations. An interesting example of the relation between time and tweets comes from new ‘sensor’ research about natural disasters that can readily be extrapolated when thinking about events like Ferguson. The use of real time event tweeting has gone so far as to help quickly identify when and where earthquakes are happening. “An important characteristic of Twitter is its real-time nature. For example, when an earthquake occurs, people make many Twitter posts (tweets) related to the earthquake, which enables detection of earthquake occurrence promptly, simply by observing the tweets”(Sakaki 2010). Using Twitter to identify target events could be the next big thing in immediate accident or natural disaster relief efforts. Researcher Sakaki considers each Twitter user a sensor and argues that they are able to hear about and report out information on earthquakes before media sources catch wind of them, possibly saving lives.
Time sensitive twitpic-ing (the strategic tweeting of images after an event) is a documented phenomenon. This time/media relation was once again documented in the 2011 U.K. riots. With the new wave of photojournalism, where user generated images are produced after crisis events, more and more tweeters are gaining recognition because of their strategically visually memorable tweets (Weller 2013). With 70% of people having smart phones (Mlot 2015) with cameras, the number of visual refection’s of reality being produced on Twitter in the time sensitive periods after events has sky rocketed (Weller 2013).
The importance of media on Twitter is clear, tweets with images receive 89% more favorites, 18% more clicks and 150% more retweets that tweets without this form of media (White 2015). However, does the power of the picture survive the test of time? Will these percentages hold fast after the immediate popularity serge of an event has subsided? This is one of the questions I evaluate in my persona research.
Research Question
I will analyze tweets via Pulsar to answer my overall research questions; what is the significance, and why should we care, about the relationship between which form of media is tweeted in relation to the time it is posted? After a monumental event occurs, are different forms of tweetable media used consistently for a specific reason?
Hypothesis
Based off of the other studies I have drawn upon in the previous section, I’ve developed theories about what I feel my research will reveal. I believe that the information gathered while conducting my research, in the hopes of finding a significant relationship between media type tweeted and time tweeted, will show three specific components. 1.) That more users tweet pictures directly following an event, however, with time this form of media decreases in popularity. 2.) The use of hyperlinks grows in popularity with time because blog's, articles or other hyperlink attachable sources take time to write and publish after an event takes place. 3.) The use of text in tweets remains popular and ever presents no matter the duration of time after an event.
Methodology
The methods I used to conduct my research centered around learned skills pertaining to the Twitter analyzing and interpreting software Pulsar. I manipulated multiple settings while observing three specific time oriented data sets to reap the exact information I wanted to acquire. That being the percentages of each type of media use in each of my time zones. I began by narrowing my research into three time frames, the first 24 hours (August 9-10), the first week (August 10-16), and the second week (August 16-23) in order to determine which forms of media (text, pictures, videos or hyperlinks) were used the most when.
Once I had the three time frames divided I used content analysis options to identify and tag tweets that had only text, or images, or videos or tweets with hyperlinks. This helped to determine which form of tweetable media was used the most when. I gained insight into tweeting patters that helped to answer my research questions and test my hypothesis.
Results
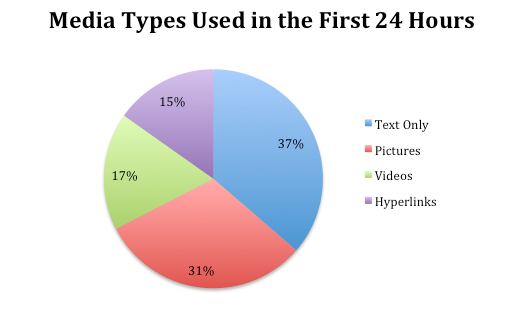
The data residing in the first 24 hours after the Ferguson shooting (12:00am August 9- 12:00am August 10) provided interesting insight into what forms of media are the first to hit the twittersphere. In these general results it’s clear that in the direct aftermath of an event people turning to social media to express their emotions or give or seek information do so mostly by using text, pictures or videos. Out of the 172 tweets that were sent in the first 24 hours after the shooting, 68 contained only text while 44 contained pictures and 40 had videos. These numbers are much higher than those containing hyperlinks, only 23 tweets that were sent in the first day that contained links.
Figure 1- This pie chart represents the percentages of 4 types of media (text, pictures, videos, and hyperlinks) tweeted out within the first 24 hours after Michael Brown was shot in Ferguson
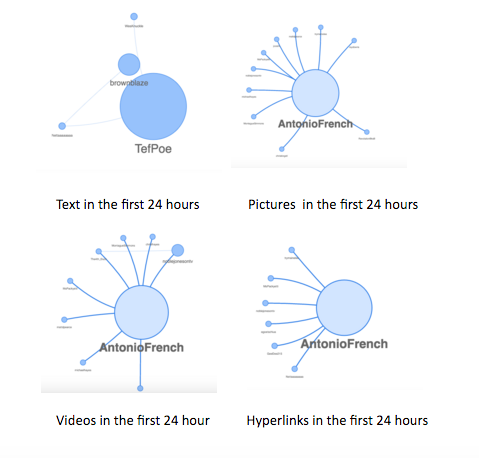
Using the same time frame, the first 24 hours after the shooting, I next examined the activists and journalists networks to see the type of reach they're tweets containing different forms of media were receiving.
Figure 2- This set of images depicts the main influencers in the first 24 hours after Michael Brown was shot in Ferguson. It is broken into the 4 different types of media that were tweeted and gages the reach that each tweeted text, images, videos or hyperlinks were able to achieve.
When looking at influence spheres, Antonio French dominated the tweetable media scene being the largest distributer of media in the immediate 24 hours after Mike Brown was shot. The network maps reveal, more so than just numbers or statistics would, that while text was the overwhelming media choice during this first time frame, tweets that had pictures were the most retweeted and made their way furthest in the twittersphere.
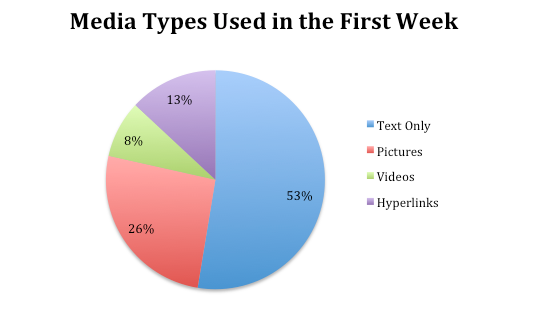
Figure 3- This pie chart represents the percentages of 4 types of media (text, pictures, videos, and hyperlinks) tweeted out within the first week after Michael Brown was shot in Ferguson
The next data set that I analyzed were the tweets shared in the first week, August 10th to 16th after the shooting. The tweets in this second time frame number 5,140 in total. With the elevated number of tweets sent came the increased number of tweets only containing text as well. In the first week after the shooting 3,030 tweets, or 53% of the sent messages did not containing pictures, videos or links, only text in comparison with only 37% of tweets being text dominated in the first 24 hours after the event. There was a fall in the overall percent of images that were tweeted, going from 31% in the first 24 hours to 26%, or 1,200 tweets in the first week. The same can be said about the number of videos being shared in the first week, which also took a drastic nosedive after the first 24 hours. The number of hyperlinks being shared stayed relatively on par compared to the first week.
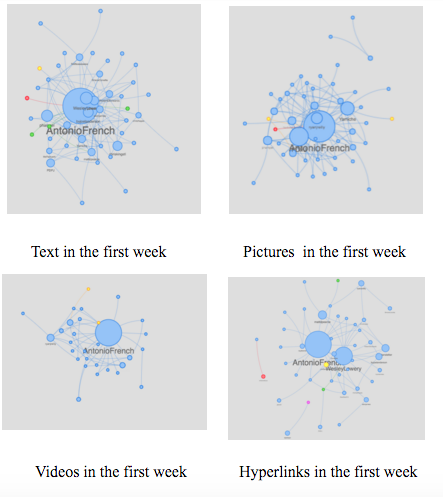
Figure 4- This set of images depicts the main influencers in the first week after Michael Brown was shot in Ferguson. It is broken into the 4 different types of media that were tweeted and gages the reach that each tweeted, text, images, videos or hyperlinks were able to achieve.
Once again while deciphering the meaning of these network maps during the first week after Ferguson, Antonio French dominated the tweetable media scene. Text was used the most in tweets, and had the greatest reach. Although images were tweeted less than half as much as text only tweets, 1,200 compared to 3,030 tweets, images continued to be shared in a tight cluster, a centralized community. Even though the overall percentage of tweeted hyperlinks went down, the 478 tweets sent in the first week after Ferguson with links reached a great population than previously. The hyperlink network is not densely populated but is still tapping into a range of spheres of influence. Videos sent in the first week were still being circulated, however, in comparison to the other forms of media they had begun to decline in popularity.
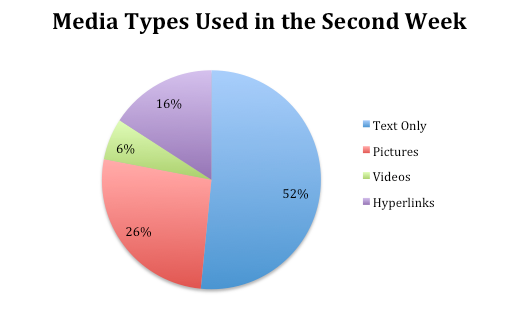
Figure 5- This pie chart represents the percentages of 4 types of media (text, pictures, videos, and hyperlinks) tweeted out within the second week after Michael Brown was shot in Ferguson
The final data set that I analyzed was that of the second week after the shooting, August 16th through August 23rd. In the second week there were 5,890 total tweets sent. This chart depicts the constant rate at which text continues to be used in tweets about Ferguson from week one to week two, topping the charts again with 3,530 tweets. The same can be said about the rate at which pictures are being shared; with a 1% rise from week 1 to week 2 tweets containing pictures were sent 1,330 times in the second week. When interpreting the progression of the pie charts from week to week it is clear the decline of the number of videos shared continues in the data significantly. Videos were initially shared 17.8% of the time in the first 24 hours after the shooting, this dropped to 8.6% in the first week, and finally down to 6.3%, only 502 video containing tweets shared in the second week post Ferguson. While on the other hand, tweeting hyperlinks grew in popularly compared to the 13.3% in the first week. During the second week 581 tweets with links were sent rising the overall percentage of this tweetable form of media to 16.3%.
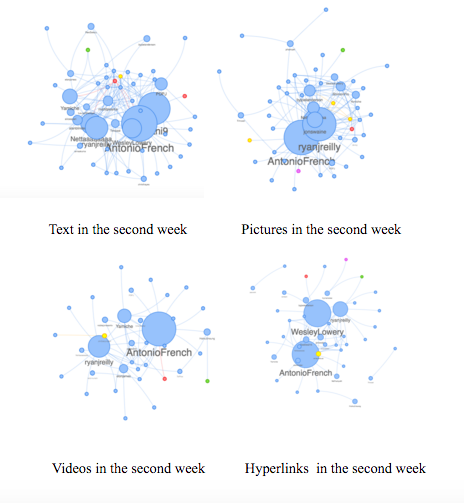
Figure 6- This set of images depicts the main influencers in the second week after Michael Brown was shot in Ferguson. It is broken into the 4 different types of media that were tweeted and gages the reach that each test, images, videos and hyperlinks were able to achieve.
This final set of network maps represents the increase in major players in the tweetable media scene. Although the percentages of tweets containing text only did not change from week 1 to week 2, both holding fast at 53% with 3,030 and 3,530 tweets respectively, more tweeters voices were being amplified and a denser population of Twitter users were retweeting these tweets. Tweets featuring images were sent roughly the same amount of times in the second week after Ferguson, 1,200 tweets in week one compared to the 1,330 tweets in the second week. However, as noted in tweets with text only, a wider variety of Twitter users are now main players helping the images reach further than they were able to in week one. Even though the percent of videos went down in week two, the established network that’s been formed for video sharing enabled this form of media to continue to reach a large audience in the second week. Hyperlinks were tweeted more in the second week, 16.3% or 581 tweets compared to the 13.3% in week one. Their sphere of influence also grew, as did the number of tweeters gaining notoriety in the Twitter-sphere.
Interpretation of Findings
Looking at the overall results I generated during my research I was able to come to valuable conclusions. By using primarily quantitative research methods, gathering numerical data over unstructured observable qualitative methods, I gathered a wealth of interpretable statistics.
My numerical data clearly shows that from the first 24 hours, to the first week, and then to the second and final week, text remained the most tweeted form of media. Beginning with 37.3% of the tweets then rising in popularity to 53% in the remaining two weeks, this clearly shows the usefulness of purely text in tweets. This information is valuable when journalist or activists are considering what to tweet in light of a recent newsworthy event. When a text only message comes across Twitter consumer’s feeds the likelihood of said information being read and retweeted is high, more than half of all tweets included text as the primary tweeted media form. The use of images in tweets was also deemed valuable. Its drop from 31.9% to 27.2% from the first 24 hours after the shooting to the second week can be explained by the lack of new tweetable images, however, clearly this does not overly diminish the reach said pictures receive in the Twitter-sphere. The same cannot be said for the use of videos tweeted after Ferguson. In the first 24 hours 17.8% of tweets contained a video, but this number fell to only 6.3% in the second week following the shooting. The lack of new and current video media being released can be blamed for this decline and should be noted by both those producing tweets, and those consuming them. If it’s videos you seek after an event you should be inclined to refer back to the breaking news posts to fulfill this desire. People relying on Twitter as a news source may feel that the images and videos released right after an event have, with time, expired and this could factor into their overall decline with time. The opposite is true when looking at the percent’s of tweeted hyperlinks. In the first 24 hours after the shooing 15.6% of tweets included links to other outside blogs or website. This number declined in the flowing week but regained traction in the second week number 581 hyperlink containing tweets, clocking in at 16.3% of the over tweets that week. The slower trajectory of this form of tweetable media may be the result of content, and the fact that it takes longer for a blog or article to be written, edited and produced than it takes to send a 140-character tweet.
The practical significance of my findings play into my overall research question, asking why we care, and what can be gained from knowing the relationship between what forms of media are tweeted and when. I had hypothesized that tweeted pictures would be popular directly following an event; however, with time this form of media would decrease in popularity. My research showed that this hypothesis was in fact valid. I was able to provide insight into methods media organizations use in order to get their tweets the most visibility possible, early use of images being one strategy. The second inquiry I hypothesized about pertained to hyperlink use; I thought that the use of hyperlinks would grow in popularity with time because blog's, articles or other hyperlink attachable sources take time to write and publish after an event takes place. This theory about the importance of time and different sources of media was proven through my data gathering and analysis. Links did in fact have a boost in popularity in the second and final week I researched. My last hypothesis about the continued importance of text no matter the time passing after an event was also valid, confirming the practical significance of this most basic form of tweetable media.
Conclusion
In summery, my research questions guided my study and lead me to draw the conclusions that ultimately proved my hypotheses to be true. After analyzing three specific times oriented data sets there are clear and observable patterns between what forms of media are tweeted by the activists and journalist observed and when they did said tweeting. Text unilaterally remains the most commonly featured form of media regardless of the elapsed time after an event. While pictures and videos, which were tweeted more in the direct aftermath of Ferguson, fade with time and lose relevance. Hyperlinks, which had been predicted to gain in popularity over time due to the fact that linkable things like news stories and blogs take more time to publish, did gain in tweets and retweets with time, however marginally so. This data is significant in predicting and understanding the forms of reliable media you can expect in the aftermath of a newsworthy event. It also could aid tweeting news and media distributers, helping them reap the most publicity based of strategically timed media postings.
The limitations I faced while conducting my research are regrettable, however given my circumstances, unavoidable. My sample size was small and also limited to the media tweeted after events from activists and journalists only. Future research could be beneficial in this regard. With a larger group of accessible tweets from a greater demographic of users, corporations and non-network affiliated people for example, a better more comprehensive understanding of the relationship between time and tweeted media could have been drawn. Expanding this study to include these other data sets, as well as a month, or even a year later tweet group would provide a more complete image of the true lifespan and relevance of the four researched forms of tweetable media.
References
Giordano, Rebekah. “TWEETING THE BOSTON MARATHON BOMBINGS: A CASE STUDY OFTWITTER CONTENT IN THE IMMEDIATE AFTERMATH OF A MAJOR EVENT.” ProfessionalProjects from
the College of Journalism and Mass Communications, May 16, 2014.
Java, Akshay, et al. "Why we twitter: understanding microblogging usage and communities." Proceedings of the 9th WebKDD and 1st SNA-KDD 2007 workshop on Web mining and
social network analysis. ACM, 2007.
MacArthur, Amanda. "The History of Twitter You Didn't Know." About.com Tech. N.p., 16 Dec. 2014.Web.20Apr.2016. <http://twitter.about.com/od/Twitter-Basics/a/The-Real-History-Of-Twitter....
Meraz, Sharon. "Networked Gatekeeping and Networked Framing on #Egypt." Networked Gatekeeping and Networked Framing on #Egypt. Sage Journal- The International Journal of Press/Politics, 27 Jan. 2013. Web. 23 Apr. 2016. <http://hij.sagepub.com/content/18/2/138.refs>.
MLOT, STEPHANIE. "70 Percent of Population Will Have Smartphones by 2020." PCMAG. Ziff Davis, 3 June 2015. Web. 04 May 2016. <http://www.pcmag.com/article2/0,2817,2485277,00.asp>.
Sakaki, Takeshi, Makoto Okazaki, and Yutaka Matsuo. "Earthquake shakes Twitter users: real-time eventdetection by social sensors." Proceedings of the 19th international conference on World wide web. ACM, 2010.
Weller, Katrin, Axel Bruns, Jean Burgess, and Merja Mahrt, eds. Twitter and Society. New York: Peter Lang Publishing Inc., 2013.
White, Amy. "How Many Characters Do Photos Use In Tweets?" DigitalMediaEducation. World Press, 11 Aug. 2015. Web. 04 May 2016. <http://digitalmedia.education/how-many-characters-do-photos-use-in-tweet....
- Log in to post comments